Engineering a Custom CANBus Analysis Tool for Automotive Applications
CANBus Message Monitoring and Analysis InterfaceIn modern vehicles, data exchange between Electronic Control Units (ECUs) takes place over the Controller Area Network (CAN) protocol. While…
CANBus Message Monitoring and Analysis Interface
In modern vehicles, data exchange between Electronic Control Units (ECUs) takes place over the Controller Area Network (CAN) protocol. While existing open-source CANBus monitoring tools are adequate for specific use cases, they often lack the modularity, customization, and scalability required for complex project environments.
For this reason, we initiated the development of a custom software platform capable of listening to CANBus traffic in real time, performing structured analysis, and presenting meaningful insights to the user. The project is still under active development, with new features and protocol support being added regularly based on real-world use cases.
This article outlines the main objectives, technical architecture, core modules, and development methodology of the system.
Project Objective
The primary goal of this application is to capture CAN frames in real time, parse them in accordance with protocol specifications, and provide users with a clear, visualized representation of the data.
Although existing tools offer similar capabilities, our system is designed with a high degree of modularity. It supports multiple connection protocols such as USB, TCP/IP, SSH tunnel, and MQTT—allowing seamless integration with various data acquisition setups. This approach eliminates compatibility issues across environments and enables unified multi-channel data management through a single interface.
Features such as live graph visualization and continuous frame monitoring are essential when working with vehicles for which no DBC file is available. The tool allows manual interpretation of raw CAN data under different testing scenarios. Multi-protocol support also provides flexibility and reliability during field validation and cross-team collaboration.
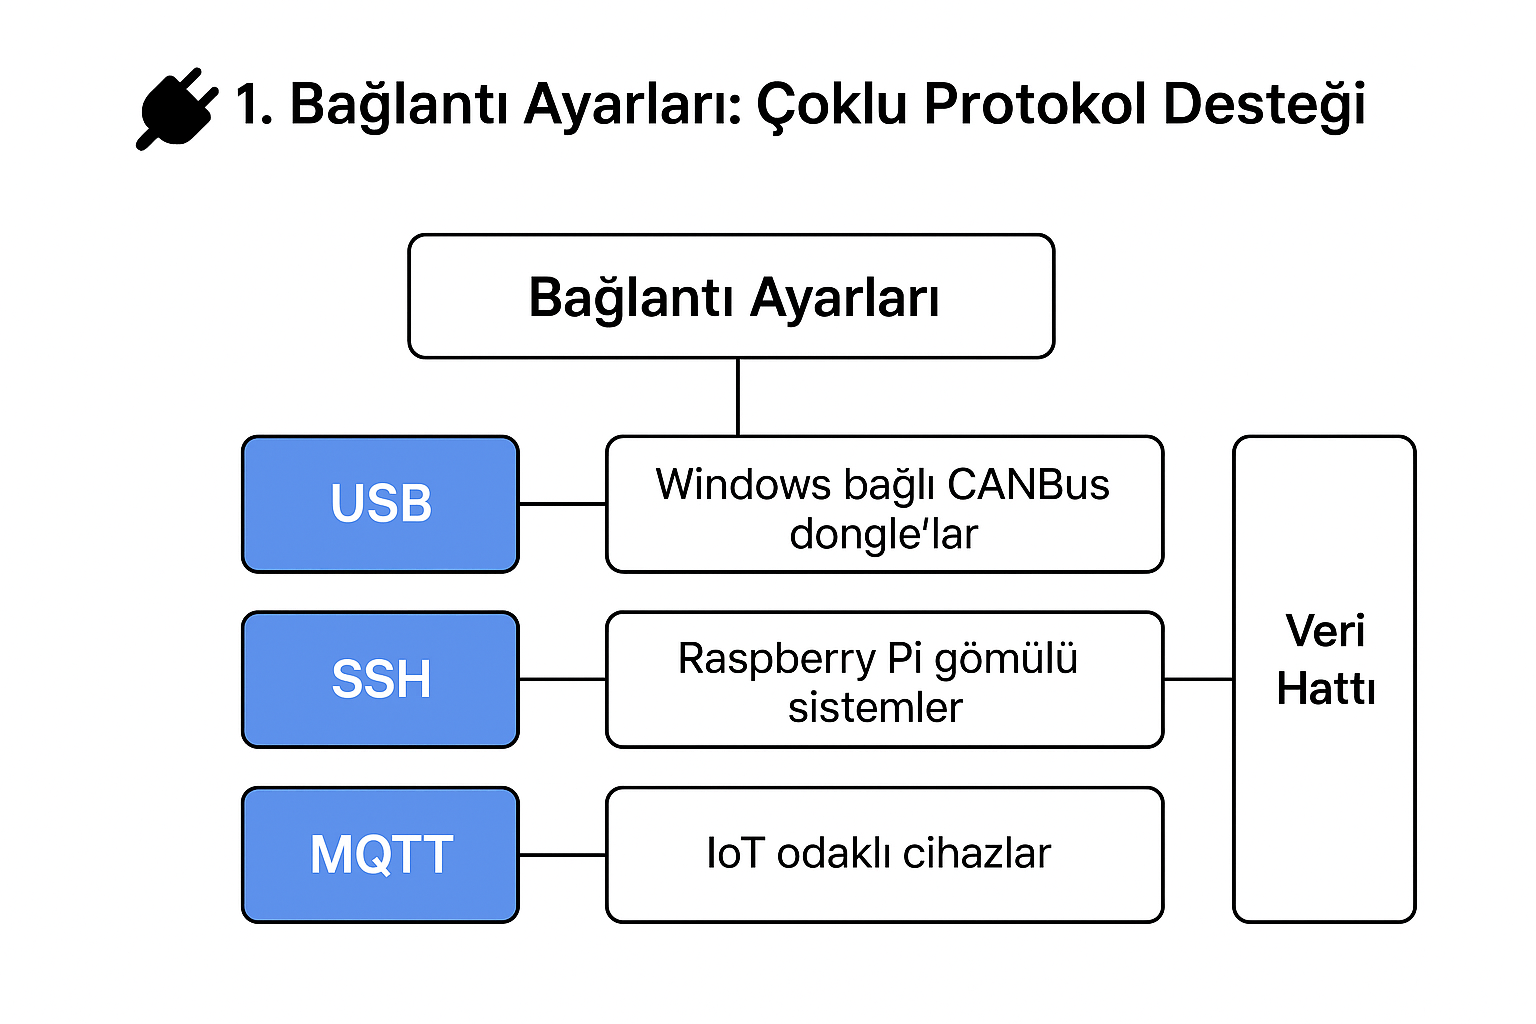
1. Connection Settings: Multi-Protocol Support
The Connection Settings module acts as the central component for managing data acquisition. It enables:
- USB Interface: Direct physical communication with CANBus dongles connected to a Windows-based system.
- SSH Tunnel: Secure remote access to embedded systems such as Raspberry Pi devices running a CAN interface.
- MQTT Protocol: Subscription to MQTT topics from IoT-oriented systems that broadcast CAN data.
This architecture ensures that the platform remains hardware-agnostic, scalable, and adaptable—capable of operating consistently across small vehicles, heavy-duty applications, and remote testing setups.
2. Interface Selection and Connection
Once the connection parameters are configured, a defined interface (e.g., can0, can1) is selected and the monitoring process starts with a single click. If the interface is properly configured, frames appear immediately on screen. The system operates seamlessly with both Windows (via USB dongles) and Raspberry Pi environments running can-utils.
3. Logging
The platform allows real-time logging of all incoming data. Supported formats include:
• JSON – for analytical processing,
• CSV – for spreadsheet analysis,
• Raw CAN – for archival storage or replay testing (to be activated once our lab setup is ready).
All frames can be recorded either continuously or on demand, depending on the selected mode.
4. DBC File Integration
The “Load DBC” feature converts raw message streams into structured, meaningful signals. When a DBC file is provided, the system displays not only message IDs but also signal names, descriptions, bit positions, and scaling information.
(Automatic DBC generation is currently under development.)
5. Message Details and Decoding
With DBC integration, each message is represented by readable signal names and actual measurement values, rather than simple hexadecimal identifiers. The accuracy of the displayed data directly depends on the quality and precision of the DBC file in use.
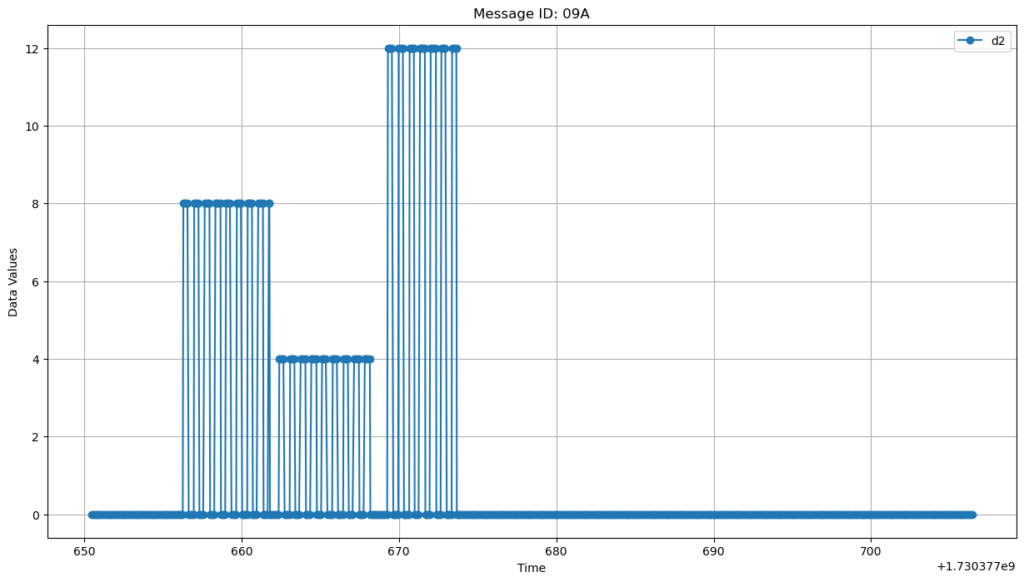
6. Live Data Visualization
Users can select a specific message ID to visualize how its values change over time. This feature is particularly useful for manual signal analysis. The example below demonstrates how message bits change when the turn signals and hazard lights are activated sequentially.
7. Traffic Visualization
The application also visualizes network load and overall message density across the CANBus. This enables engineers to easily observe how additional sensors or system modifications affect bus performance and timing behavior.
8. ID Filtering
Since CANBus communication can be extremely dense, the ID Filter feature allows users to isolate specific message IDs for targeted observation. This greatly improves focus and efficiency during scenario-based testing.
9. Main Message Panel
All captured frames are displayed in a structured table format containing the timestamp, message ID, and data bytes. This clear layout ensures quick access to the most relevant information while maintaining readability during live sessions.
10. Theme Customization
This feature proves especially useful during field tests. In bright daylight, using light themes significantly improves visibility while performing diagnostics directly on the vehicle.
At Refons Technology, we deliver specialized software and consulting services for automotive CANBus projects — including system analysis, prototyping, security testing, and embedded software development. By understanding each client’s unique requirements, we design scalable and efficient solutions that address real-world engineering challenges. To collaborate or discuss potential projects, feel free to reach out to our team.
Yunus Emre Çetinkaya
https://www.linkedin.com/in/yunus-emre-%C3%A7etinkaya-88a0b7218
12 August 2025